Introduction
Executive Summary
Cluster monitoring has different requirements based on data center size, purpose, the amount of available bandwidth for monitoring functions and the need for 3rd party support. We show a RAS aggregation approach which leverages open source tools to aggregate sensor and alert data from OpenBMC’s management interface. Through a highly configurable broadcast subscription service and an extensible plug-in framework, telemetry data can be collected, associated with cluster jobs, and nodes actively monitored without impacting job performance. We demonstrate how AC922 management is possible with Netdata, Kibana, and Grafana.
Introduction
IBM’s AC922 system design motivated by the SUMMIT and SIERRA supercomputer requirements. As a large scale-out system, each contribution to management network load deserves careful consideration to ensure quick communication of reliability or failure events and the flexibility of a prescriptive configuration a requirement.
The AC922 was IBM’s first system to use OpenBMC for its onboard system control. OpenBMC implements a REST API with features motivated by the Redfish API. These interfaces allow for the configuration of event and monitoring along with enabling tuning per the desired load on the cluster management network.
There are several options for cluster management and many administrator teams have written extensible solutions tailored to their sites. In supporting a test and development cluster, our goal was to use up to 50% of the network for system sensor monitoring without adding jitter to workloads. We explored NetData because of its active community, the availability of plugins for major cluster functions, and because it was running for us within a half day after the initial download.
In as much as real time sensor data was important, this is eclipsed by the importance of the system identifying a functional fault or has otherwise detected a non-optimal condition. Depending on the cluster policy, these events may indicate a need for service due to loss of redundancy or even immediate action. These events are used by cluster managers, like IBM’s Cluster Service Manager (CSM), to take nodes out of service for maintenance. We show how these events can be logged to Logstash and displayed by Kibana or by Grafana.
This white paper documents the architecture of our cluster monitoring system with the intended audience being administrators who are looking for an Open Source solution for monitoring an AC922 cluster or administrators integrating AC922s into existing solutions. In either situation, the key components are defined in the Key Software Components table and of those, the IBM Cluster RAS Service Daemon (ibmcrassd), is the highly configurable cluster aggregator that allows for scalable processing of node telemetry and system alert propagation.
Key Software Components
| Open Source Software | Function | Host |
|---|---|---|
| OpenBMC | Monitors system check-stop, fan failure, vital component deconfiguration, power supply failure, DIMM failure, CPU failure, GPU failure, voltage regulator failure, thermal shutdown, unable to communicate with OCC, hostboot procedure callouts | Compute Node BMC |
| xCAT (optional) | Enables autoconfiguration for ibmcrassd by providing the association BMC IPs and service group in clusters with tiered service node architectures | Service Node |
| Ibmcrassd | aggregation, event creation, pairing RAS policy to events, plug-in support for downstream processing | Service Node |
| Netdata plugin for ibmcrassd | This plugin for NetData allows it to communicate with ibmcrassd service for sensor monitoring | Monitoring node |
Sensor Monitoring
OpenBMC presents sensor data to the management BMC interface and receives some from the Host OS. There are 113 sensors that are available from the BMC’s management interface.
The default for Netdata was to poll data every 1 second. This level of monitoring requires at worst 21 Kb/s per compute node from the BMC to the Service node running ibmcrassd and 6.8 Kb/s from the Service node to the Netdata server per compute node. The connection to the OpenBMC is more efficient than outlined above, since the OpenBMC only sends a push notification when the sensor value changes. The 21 Kb/s figure represents all sensors being updated every second.
In addition to the network load outlined above, the sensor data is cached by ibmcrassd, using ~21 Kb of memory per monitored node. Furthermore, the processing of push web-socket notifications from the BMCs uses 0.3% to 1% of a CPU core per monitored node. Scaled up to 300 monitored nodes, ibmcrassd scales the service with 50 monitored nodes per CPU core. For example 6 monitoring cores are used to monitor 300 nodes, with each core utilizing 15% to 50% of the core. In addition to this another core is dedicated to sending data to clients, which uses on average 0.3% of the CPU core per subscribed client.
To start monitoring sensor readings with Netdata, we installed the Netdata plugin for ibmcrassd, started ibmcrassd service on the service node with telemetry enabled in the configuration file, then started the Netdata service on the monitoring node. The plugin subscribes to the telemetry stream on the ibmcrassd service, by opening the configured socket defined by a port number and the IP/hostname. Sensor data transmissions then begin immediately with sending everything. The plugin does not take advantage of the filtering and update frequency rates as it gets all sensors at a rate of once per second. It then updates Netdata with the sensor values at a rate of once per second.
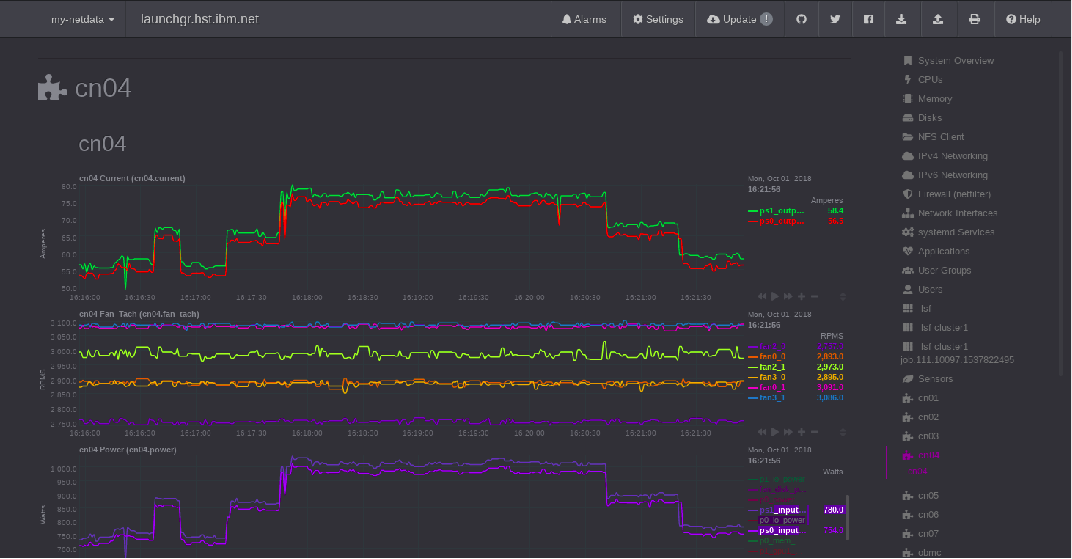
The screen shot above was used to review the power supply balance during the execution of a CPU GEMM test.
Alerts
The alerts provided by the OpenBMC are used to indicate a change in the state of the compute node. While the ibmcrassd service does NOT track the state of each compute node, it aggregates these and enables other programs to subscribe and use the information for active cluster management. This is implemented for CSM and designed for easy integration to existing management frameworks.
The ibmcrassd service converts the base alert provided by the BMCs into a common format so that all openbmc based machines have a common look and feel. This is done using a policy table that is specific to a machine type. These policy tables can be converted and tailored by an end-user to add or change alert properties in accordance to the service strategy of the site. In addition to this, the CSM plugin also has its own policy table, in addition to the base one used for translating the BMC alerts, so it can be instructed how to react, without needing any base knowledge of the underlying hardware.
Each endpoint for alerts to the ibmcrassd service is treated as a plugin that must be enabled for alerts to be forwarded to it. The service tracks the status and last communication to each endpoint individually, such that, if communication is lost to an endpoint, it will be resumed, once the endpoint is back online. This status is tracked in a file that must be located within persistent storage. To support stateless service nodes, a persistent storage location can be specified in the ibmcrassd configuration file.
The following figure shows an example of sending alerts into multiple systems managers including an IBM proprietary manager for Elastic Storage Server (ESS), CSM, and Logstash as an entry to an ELK stack.
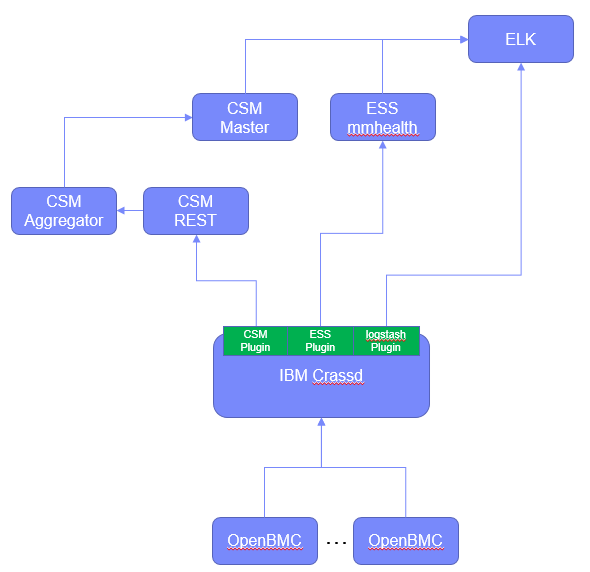
Figure : Example alert flow with ibmcrassd to multiple endpoints
It is important to note that all of the alert management is contained to a single physical CPU core at any given point in time. It leverages multiple I/O based threads to process the information as needed. The service has proven very stable, even in an event storm. When original put on-line in a cluster with 6 months of old alters, it processed about over 35,000 alerts from over 4,000 nodes in less than five minutes.
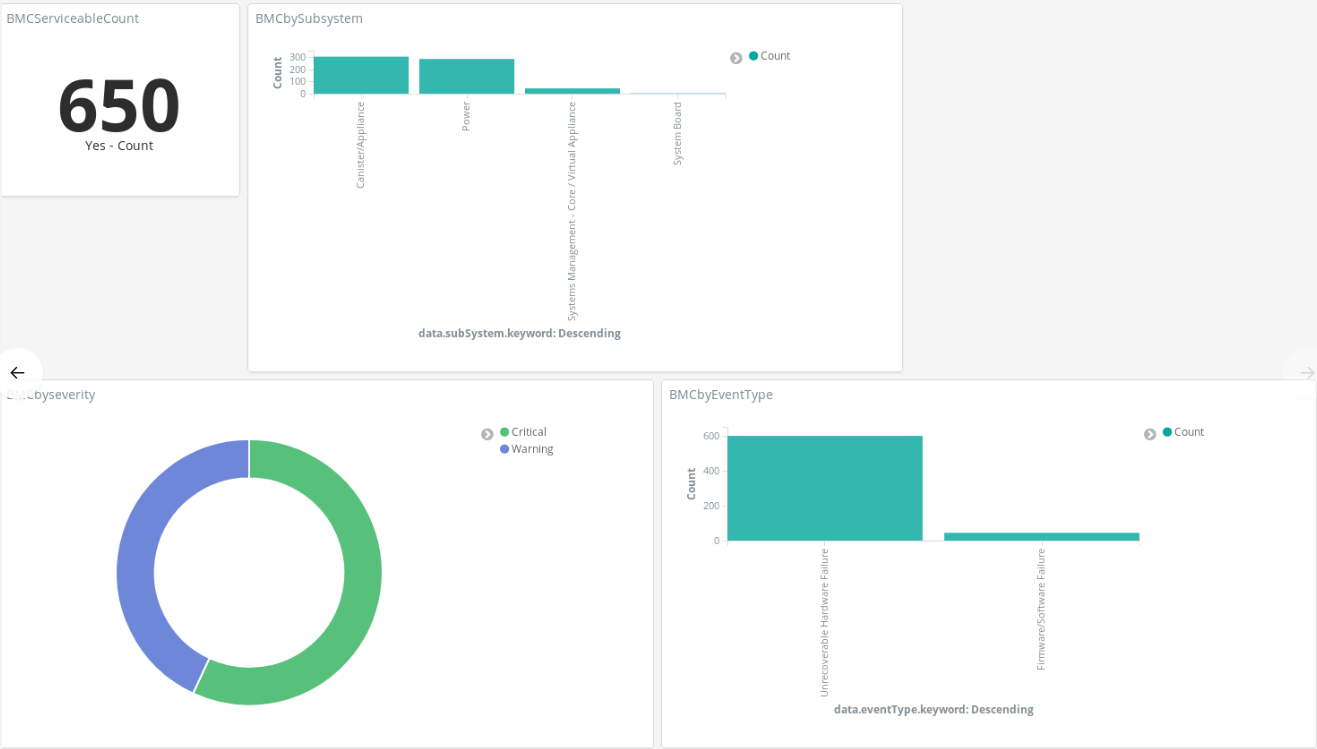
Figure : An Example Kibana Dashboard
Scalability
The ibmcrassd can effectively monitor up to 288 compute node BMCs with 8 POWER9 grade CPU cores. Its scalable architecture registers a web socket with each compute node BMC and configures events with OpenBMC.
Using the HTTPS REST API management interface, the ibmcrassd service first logs into the node to establish a session. It then uses the session information to subscribe to BMC alerts. An I/O based thread is used for each monitored node. This will result in a maximum of 288 threads that listen for push notifications.
When an alert notification is received, one of the configured number of worker threads are woken up to process the node alerts. It then ensures no alerts were missed by querying the specified BMC for all alerts. Each event is reviewed against the programmable policy table to extend the event with node attributes. Each new event is then forwarded to the configured plugins. The plugin architecture allows downstream archiving and analysis, active cluster monitoring with event propagation (less than 20 sec), and visualization. Plugins are currently available for IBM’s Cluster Service Manager (CSM), Netdata, and Logstash.
For the sensor data stream, more processing power is needed, and the service had to be made scalable to use multiple physical cores of the service node’s CPUs. In addition to all of the I/O threads above for alerts, we again have 288 I/O threads for listening to sensor data with a web-socket push mechanism. Each of the I/O threads is paired with another I/O thread that processes the sensor data notification and stores it into a cache. The updates are then forwarded to the client subscription sub-process.
A separate CPU core is dedicated to handling client subscriptions to ensure that the clients receive a responsive interface, regardless of what the remainder of the ibmcrassd service is handling. Given the dedication of multiple physical cores, these will appear as multiple instances of the ibmcrassd service, if for instance, the top command is run on the service node.
Conclusion
With providing both a live feed of sensor data and alerts to varying systems managers, hardware centric monitoring no longer requires a separate management system. Folding nicely into existing open-source management tools, with great flexibility, a single pane of glass for systems management becomes possible. This holds true through the two types of systems management models of distributed vs centralized.
The ibmcrassd service is light enough on systems resources it can be run alongside systems managers that are distributed, or it can be run on a centralized service node, to allow for maximum performance of managed nodes. By fitting both models of management, it will drive consistency for IBM hardware, regardless of what manager is used, and ensure a quality production environment is delivered.
Key References
Netdata: https://github.com/netdata/netdata/wiki
Grafana: https://grafana.com/
Logstash (ELK): https://www.elastic.co/elk-stack
OpenBMC: https://www.openbmc.org/
IBM Power System AC922: https://www.ibm.com/us-en/marketplace/power-systems-ac922